The Analyze tab uses Amazon’s hourly data to suggest big adjustments for the hour of the day and day of the week.
Here’s how to set up each section.
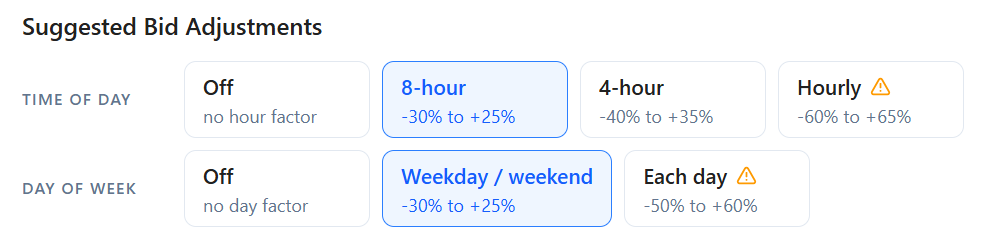
AdLabs recommends starting with broader segments (8-hour, weekday/weekend) and moving to more granular settings as data builds up.
Time of Day
Controls how the day is divided for analysis.
Setting | What it does |
|---|---|
Off | No time-of-day factor. Bids stay flat across the day. |
8-hour | Splits the day into three blocks. |
4-hour | Splits the day into six blocks. |
Hourly | One adjustment per hour. |
Day of Week
Controls how days are grouped.
Setting | What it does |
|---|---|
Off | No day-of-week factor. |
Weekday/weekend | Groups Monday through Friday vs. Saturday and Sunday. |
Each day | Separate adjustment for every day of the week. |


Metric
You can adjust these metrics depending on your strategy and needs.
AdLabs recommends RPC (Revenue Per Click) as the default because it captures both conversion rate and order value in a single number.
Rounding
How the suggested bid adjustments are rounded:
5% steps: Rounds each adjustment to the nearest 5% (e.g., +15%, -20%). Simpler and easier to manage.
Exact: Uses the precise calculated percentage. More accurate but produces less clean numbers.
AdLabs recommends 5% steps.
Click Confidence
This controls how much data a time segment needs before AdLabs will suggest an adjustment for it.
The formula is:
aCTC = Average Clicks to Convert. So clicks/orders.
The confidence multiplier (default: 10) means each segment needs at least 10 conversions' worth of clicks before it is considered reliable.
For example, if your aCTC is 27.8, the minimum is 10 x 27.8 = 278 clicks per segment.
The higher the multiplier, the more conservative the suggestions, but the more data you need.
When you first connect an AdLabs account, we will pull 14 days of historical hourly data.
We will continue to store your hourly data for as long as you’re connected to AdLabs.
RPC vs. CPC Chart
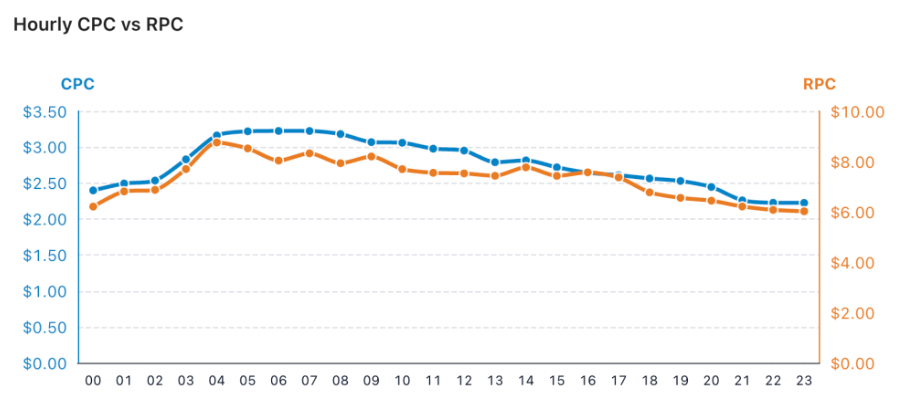
An account with super dialed in bids for day of the week and hour of the day will have the RPC and CPC basically in line.
Like this:
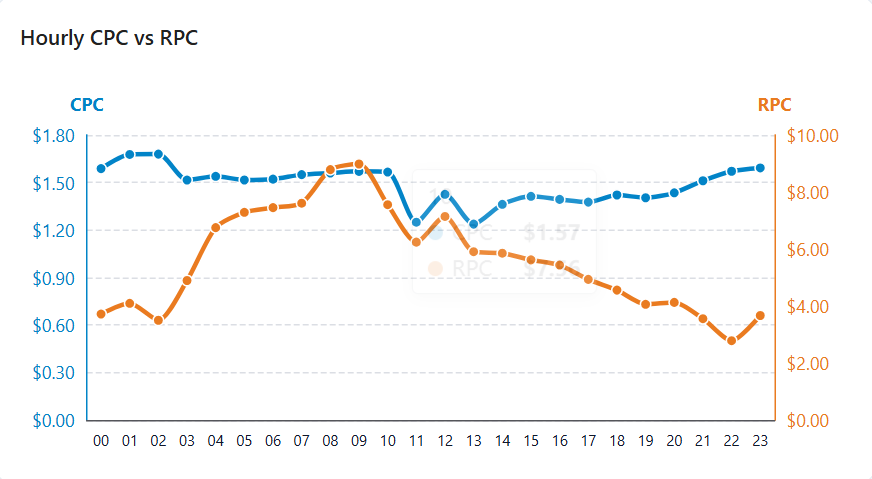
Whereas an account that could really benefit from dayparting will have a much larger gap.
Like this:
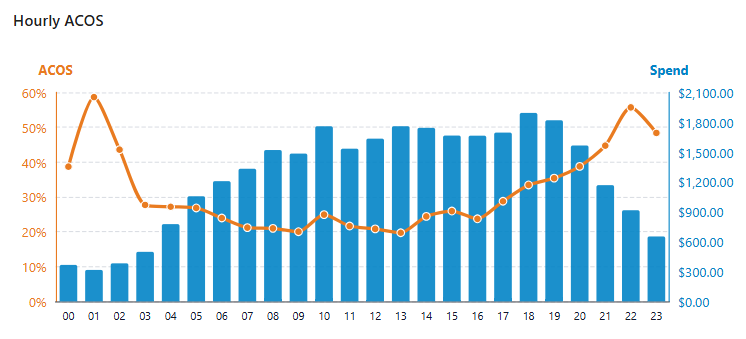
For the hourly/daily ACoS charts, you would want to see the spend distribution (bars) follow a natural traffic curve -- low overnight, ramps up in the morning, peaks during business hours, tapers off in the evening.
It means the account is paying roughly the same efficiency per click regardless of the hour.
Like this:
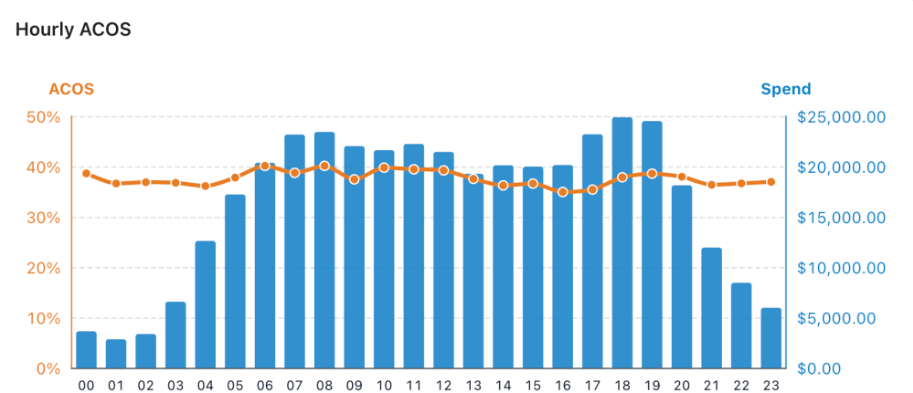
On the other hand, you can see in the example below that ACoS is creeping up around 6:00 PM, but spend doesn’t follow accordingly.
For how to set up and apply a dayparting schedule, see the companion article below.
How to Set Up & Use Dayparting in AdLabs
A guide to creating dayparting schedules, understanding how they work with bids, and what to expect once a schedule is active.
